Dashboard Guide
import { Aside } from ‘@astrojs/starlight/components’;
GreenKube includes a modern web dashboard built with SvelteKit and ECharts, served directly by the FastAPI backend. No additional deployment required — it ships inside the same container.
Accessing the Dashboard
Section titled “Accessing the Dashboard”After deploying GreenKube, access the dashboard via port-forward:
kubectl port-forward svc/greenkube-api 8000:8000 -n greenkubeThen open http://localhost:8000 in your browser.
Dashboard Pages
Section titled “Dashboard Pages”📊 Dashboard (Home)
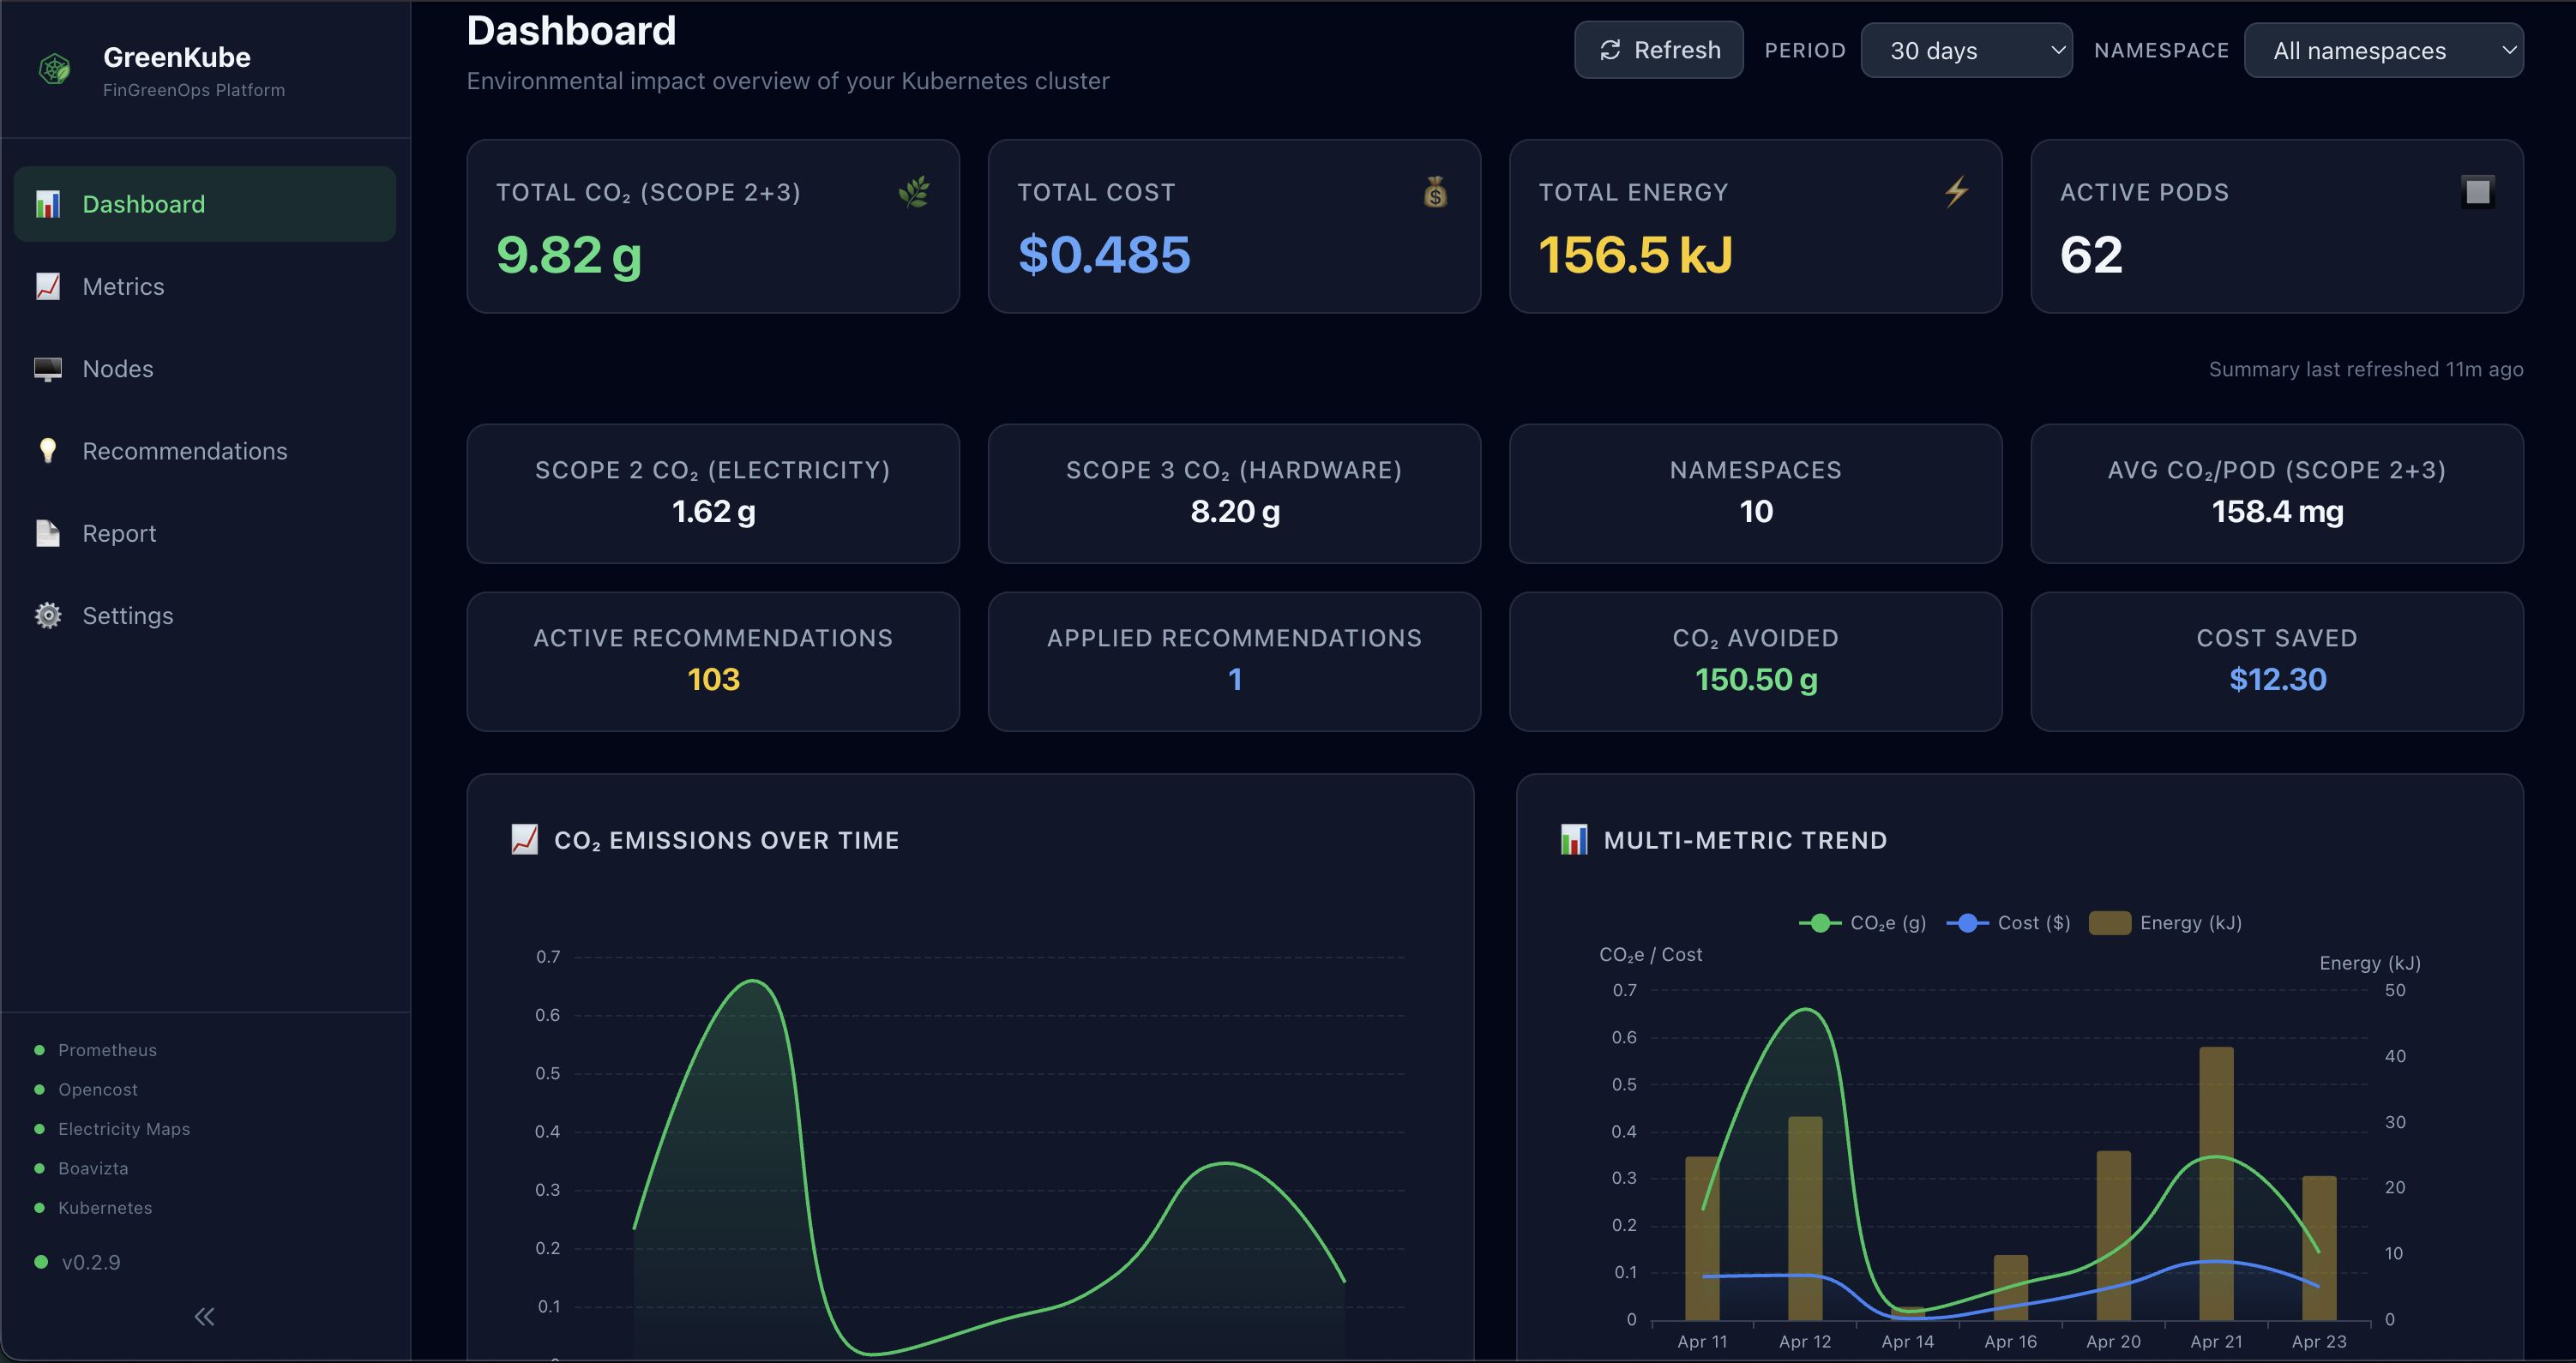
Section titled “📊 Dashboard (Home)”The main dashboard provides a high-level overview of your cluster’s environmental and financial impact:
KPI Cards:
- Total CO₂e — Scope 2 operational carbon emissions
- Embodied CO₂e — Scope 3 category 1 hardware lifecycle emissions
- Total Cost — Combined cost from OpenCost data
- Total Energy — Energy consumption in kWh
- Active Pods — Number of monitored pods
- Sustainability Score — 0–100 composite score across 7 dimensions
Charts:
- Time-series chart — CO₂ emissions and cost trends over time (ECharts)
- Namespace breakdown — Pie chart showing emission distribution by namespace
- Top pods — Bar chart of highest-emitting and most expensive pods
📈 Metrics
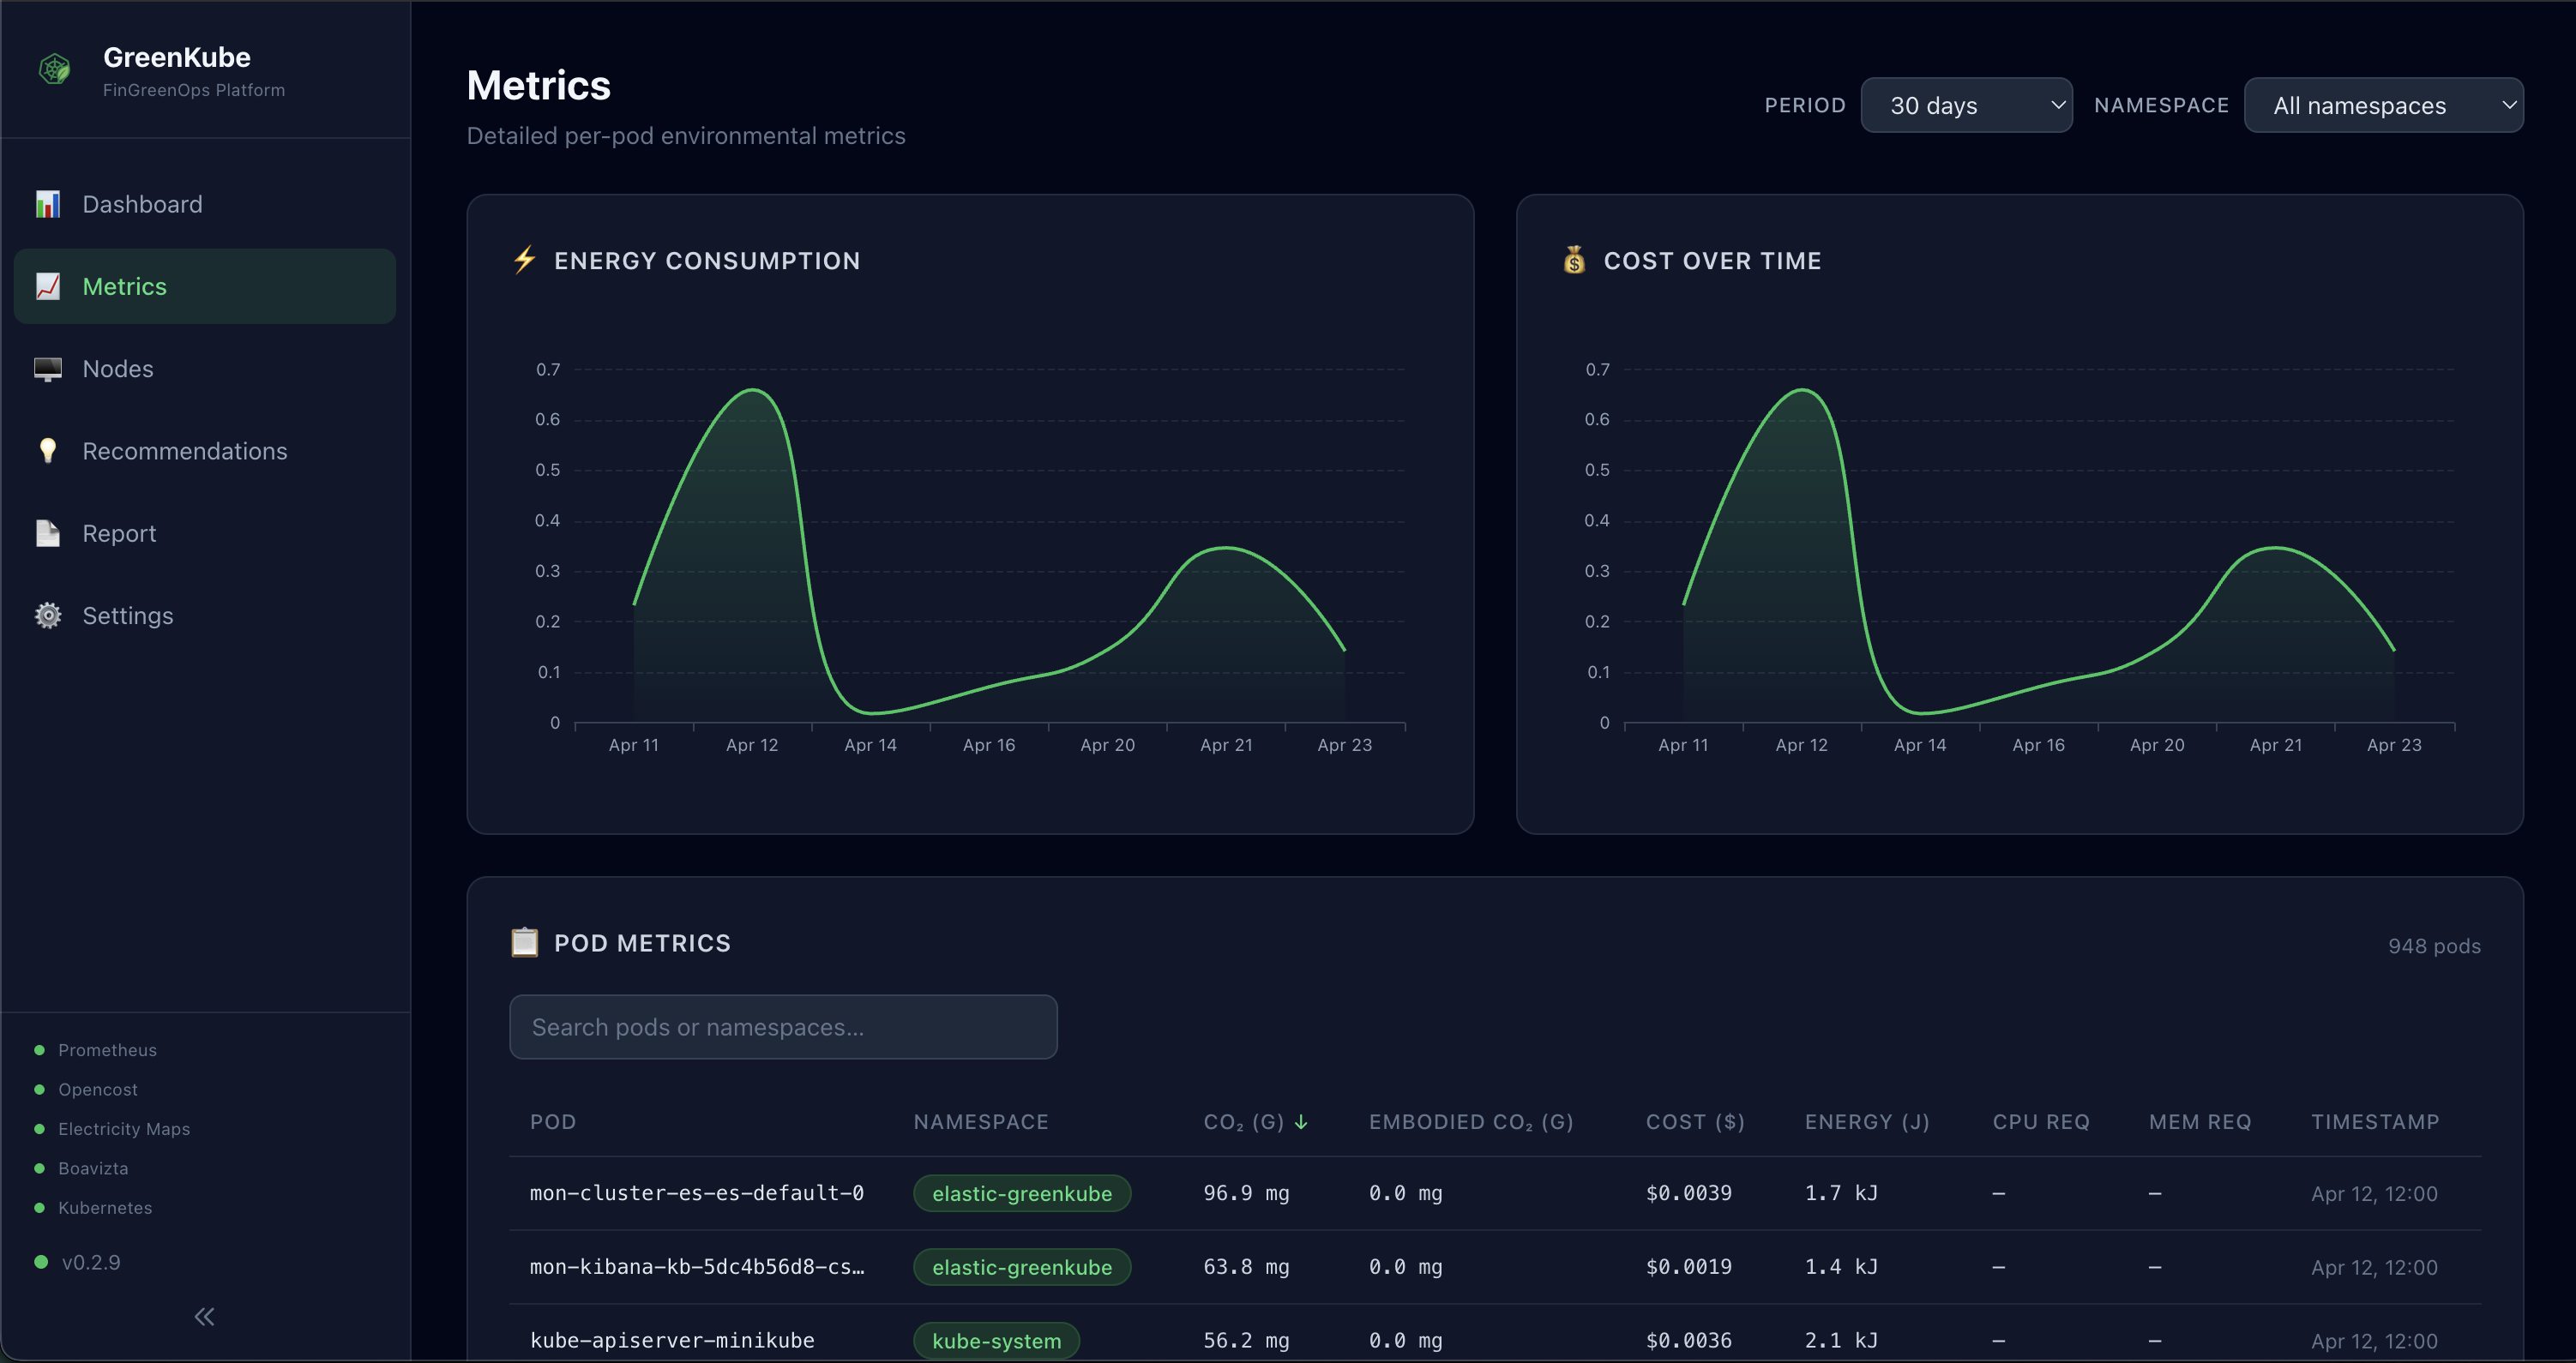
Section titled “📈 Metrics”An interactive, sortable, and searchable table with per-pod metrics:
| Column | Description |
|---|---|
| Pod Name | Full pod identifier |
| Namespace | Kubernetes namespace |
| Energy (J) | Energy consumption in Joules |
| CO₂e (g) | Carbon emissions in grams |
| Cost ($) | Allocated cost |
| CPU Usage | Actual CPU utilization (millicores) |
| CPU Request | Requested CPU (millicores) |
| Memory Usage | Actual memory (bytes) |
| Memory Request | Requested memory (bytes) |
| Network Rx/Tx | Network bytes received/transmitted |
| Disk Read/Write | Disk I/O bytes |
| Storage | Ephemeral storage usage |
| Restarts | Container restart count |
Features:
- Sort by any column (ascending/descending)
- Search/filter by pod name or namespace
- Export table data to CSV or JSON
- Pagination for large clusters
🖥️ Nodes
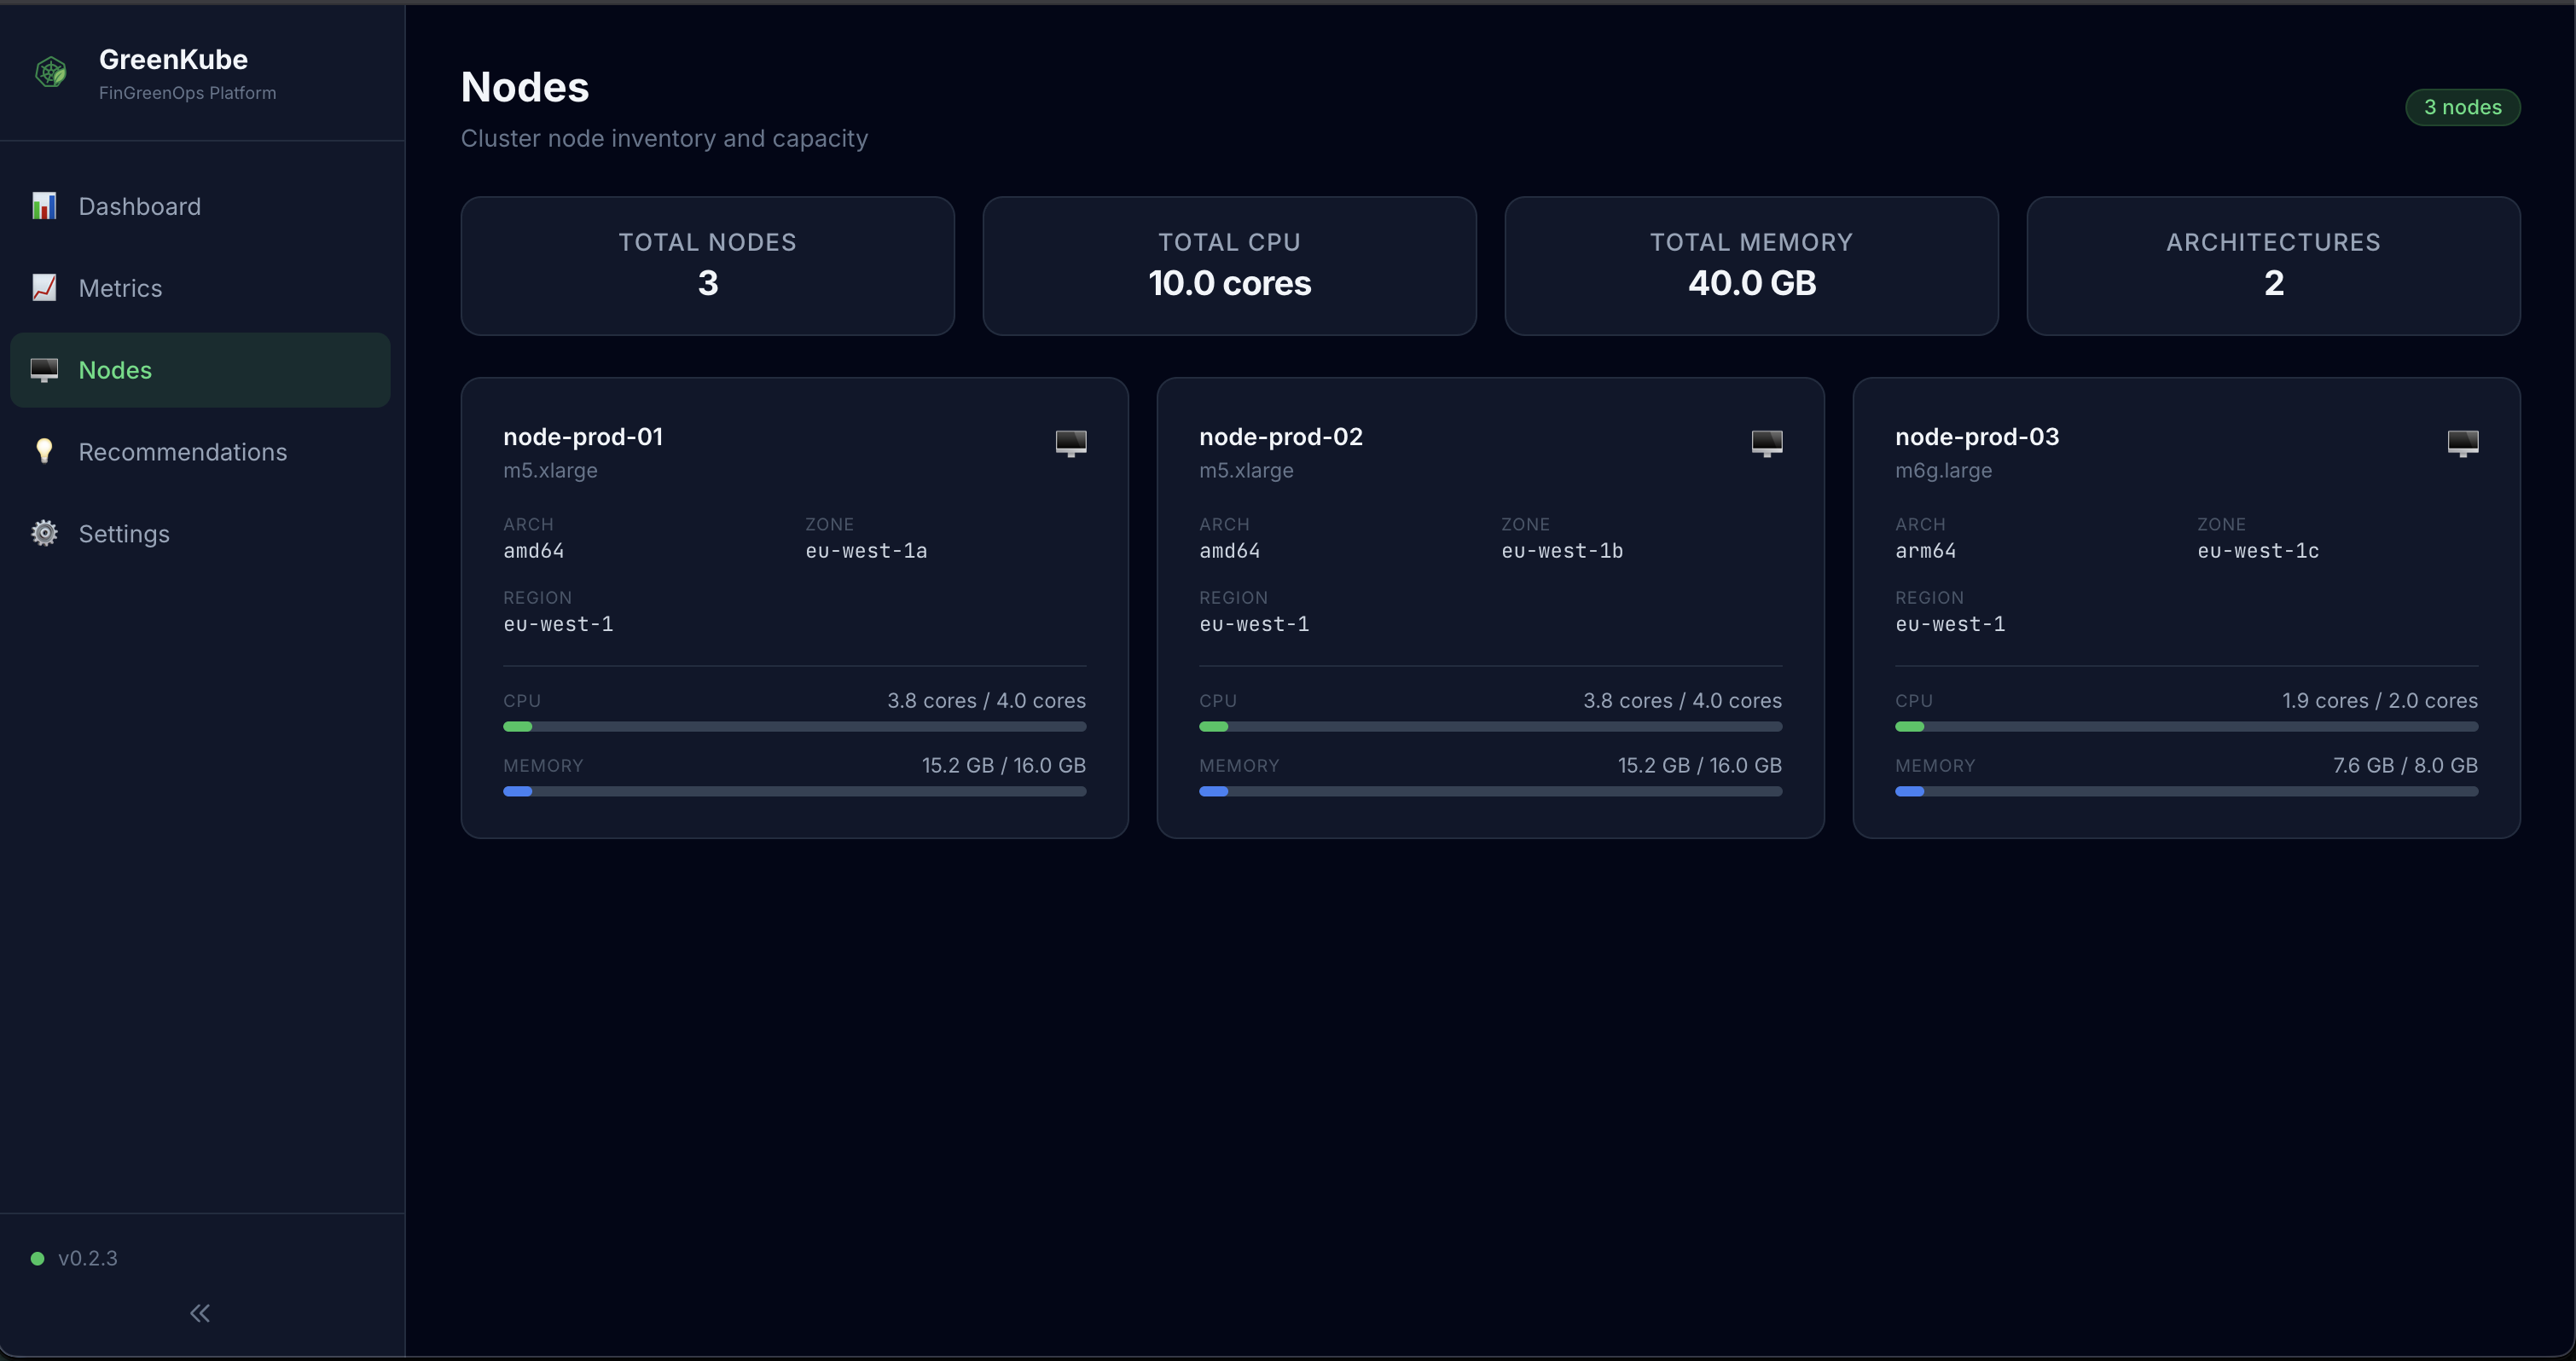
Section titled “🖥️ Nodes”The node inventory page displays all cluster nodes with:
- CPU/Memory capacity bars — Visual representation of available resources
- Instance type — Cloud provider instance type (e.g.,
m5.xlarge) - Cloud provider — Detected cloud provider
- Availability zone — Node zone/region
- Carbon zone — Mapped Electricity Maps zone
- Architecture — CPU architecture (amd64, arm64)
- Operating system — Node OS
💡 Recommendations
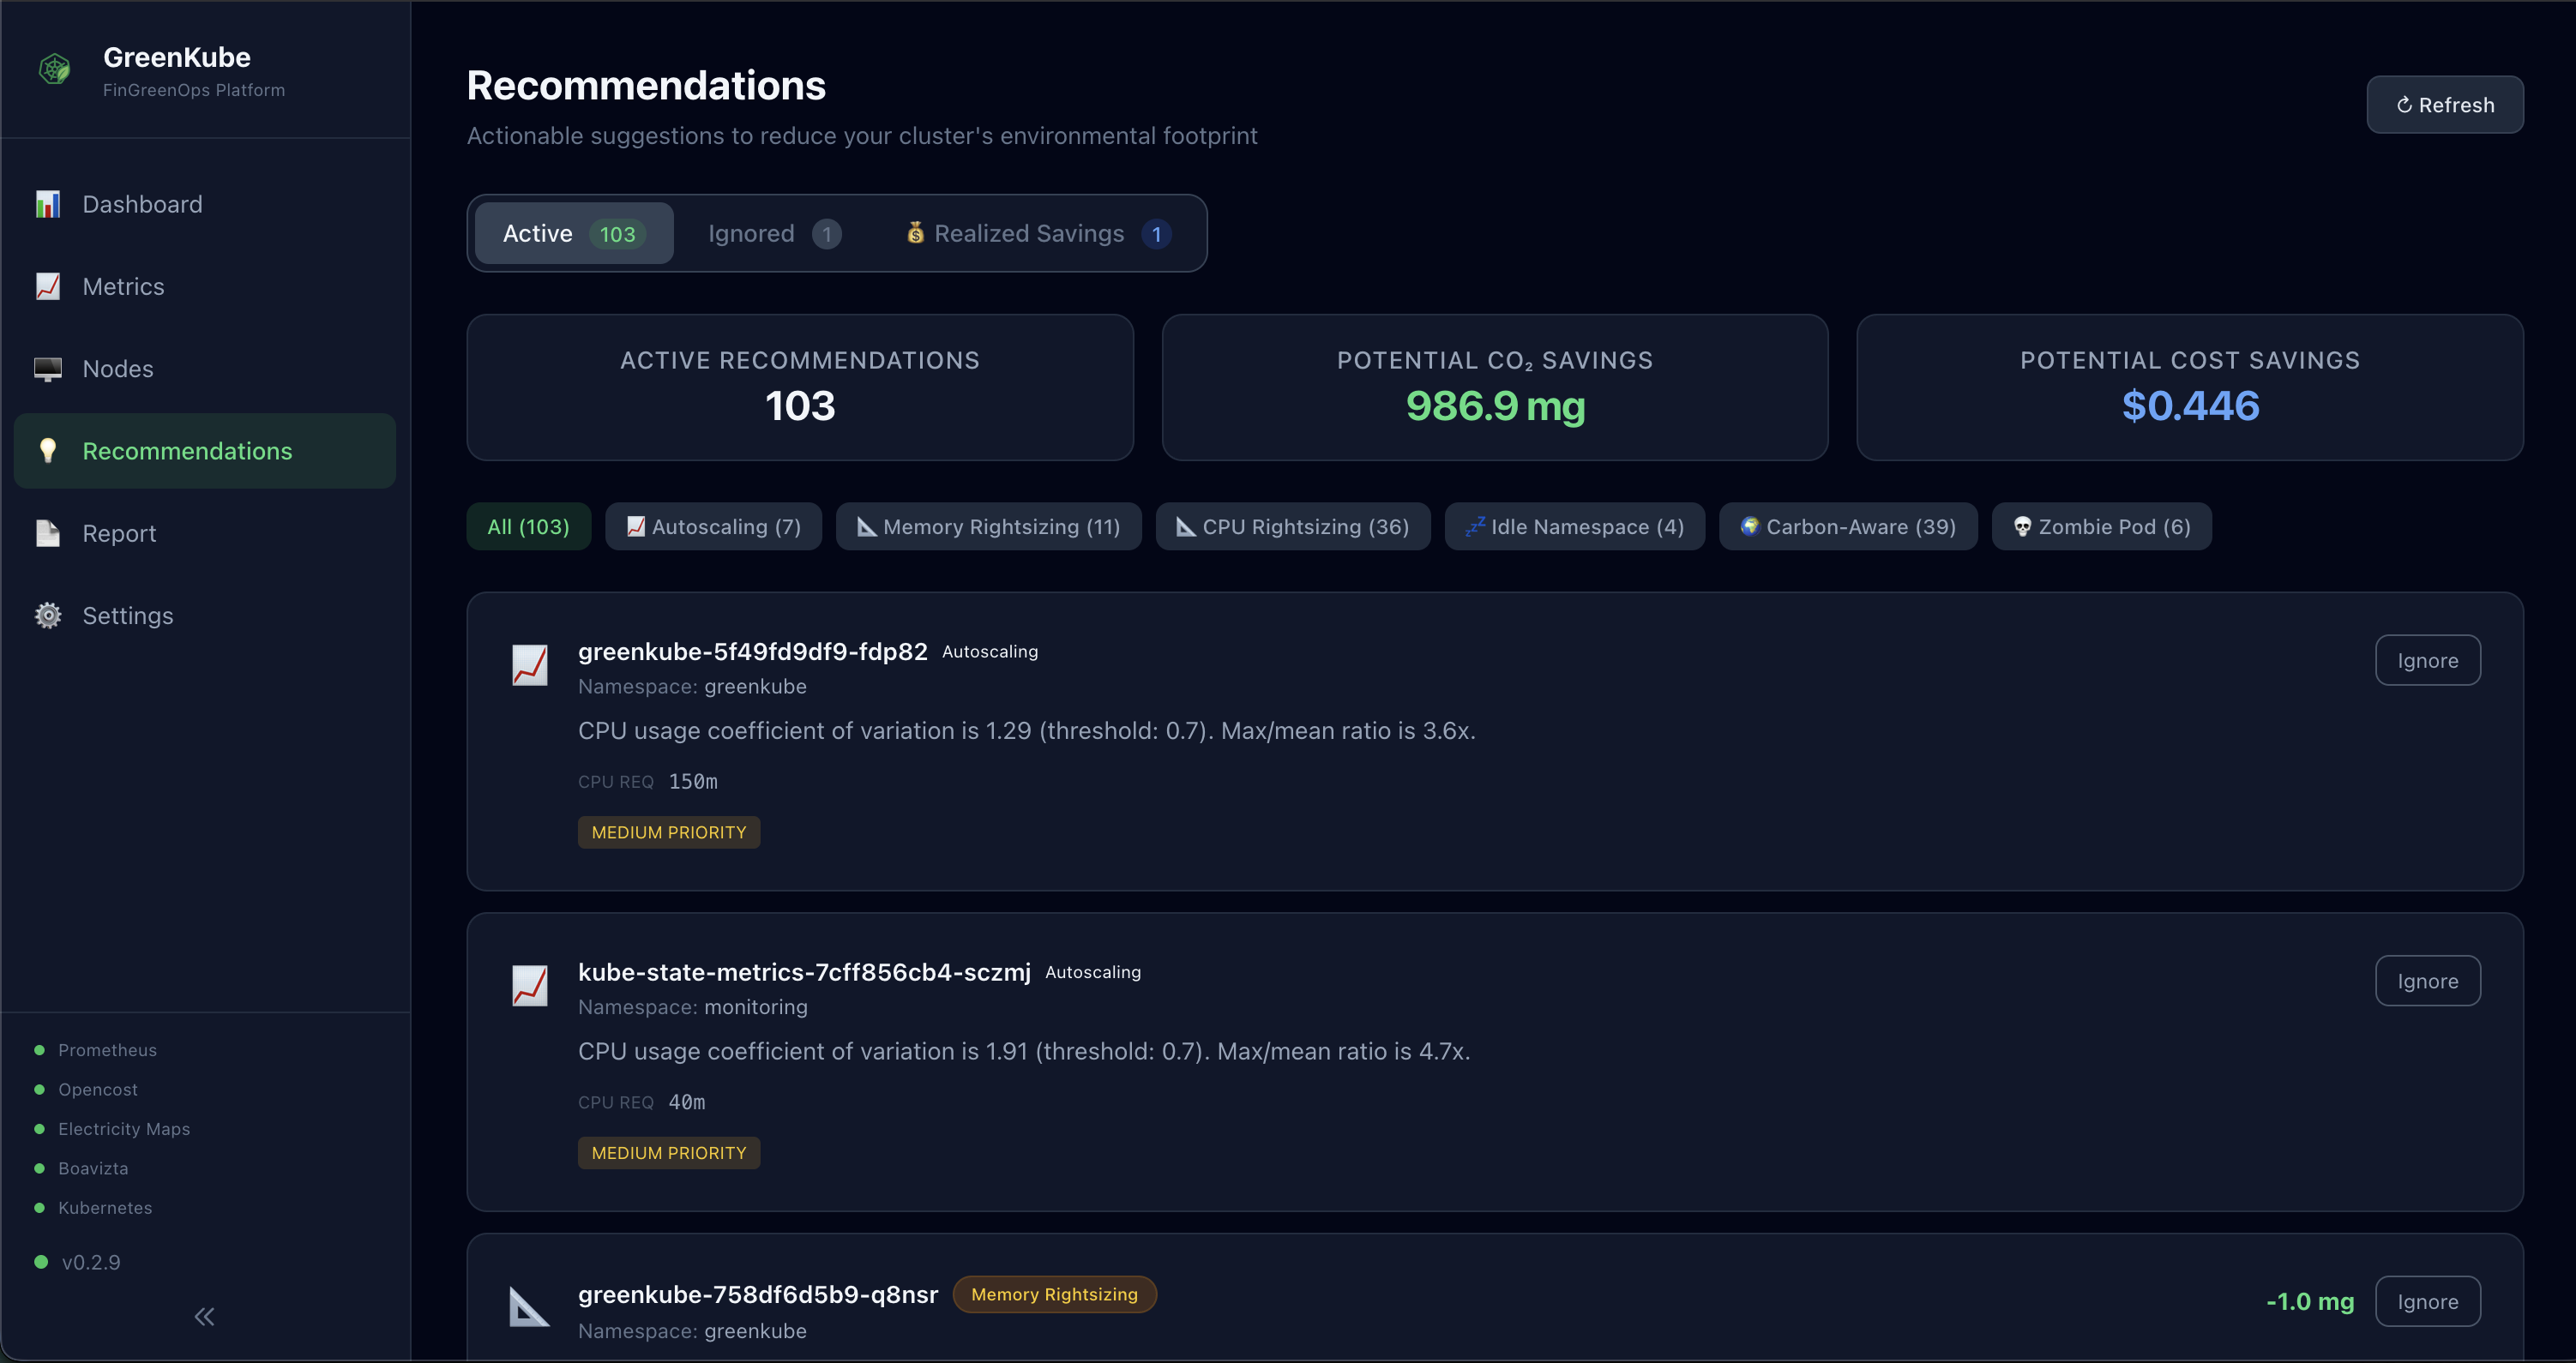
Section titled “💡 Recommendations”Actionable optimization suggestions organized by type and lifecycle status:
Recommendation Types: Zombie Pod, CPU/Memory Rightsizing, Autoscaling Candidate, Carbon-Aware Scheduling, Idle Namespace, Off-Peak Scaling, Overprovisioned Node, Underutilized Node
Tabs: Active, Ignored, Realized Savings
Each recommendation includes:
- Priority (high, medium, low)
- Scope (pod, workload, namespace, node)
- Annual savings projection (CO₂e + cost)
- Ignore flow with a required reason
- Restore action from the Ignored tab
- Applied recommendations summarized in the Realized Savings tab
The current UI does not expose an Apply button yet; applying a recommendation is done through the API.
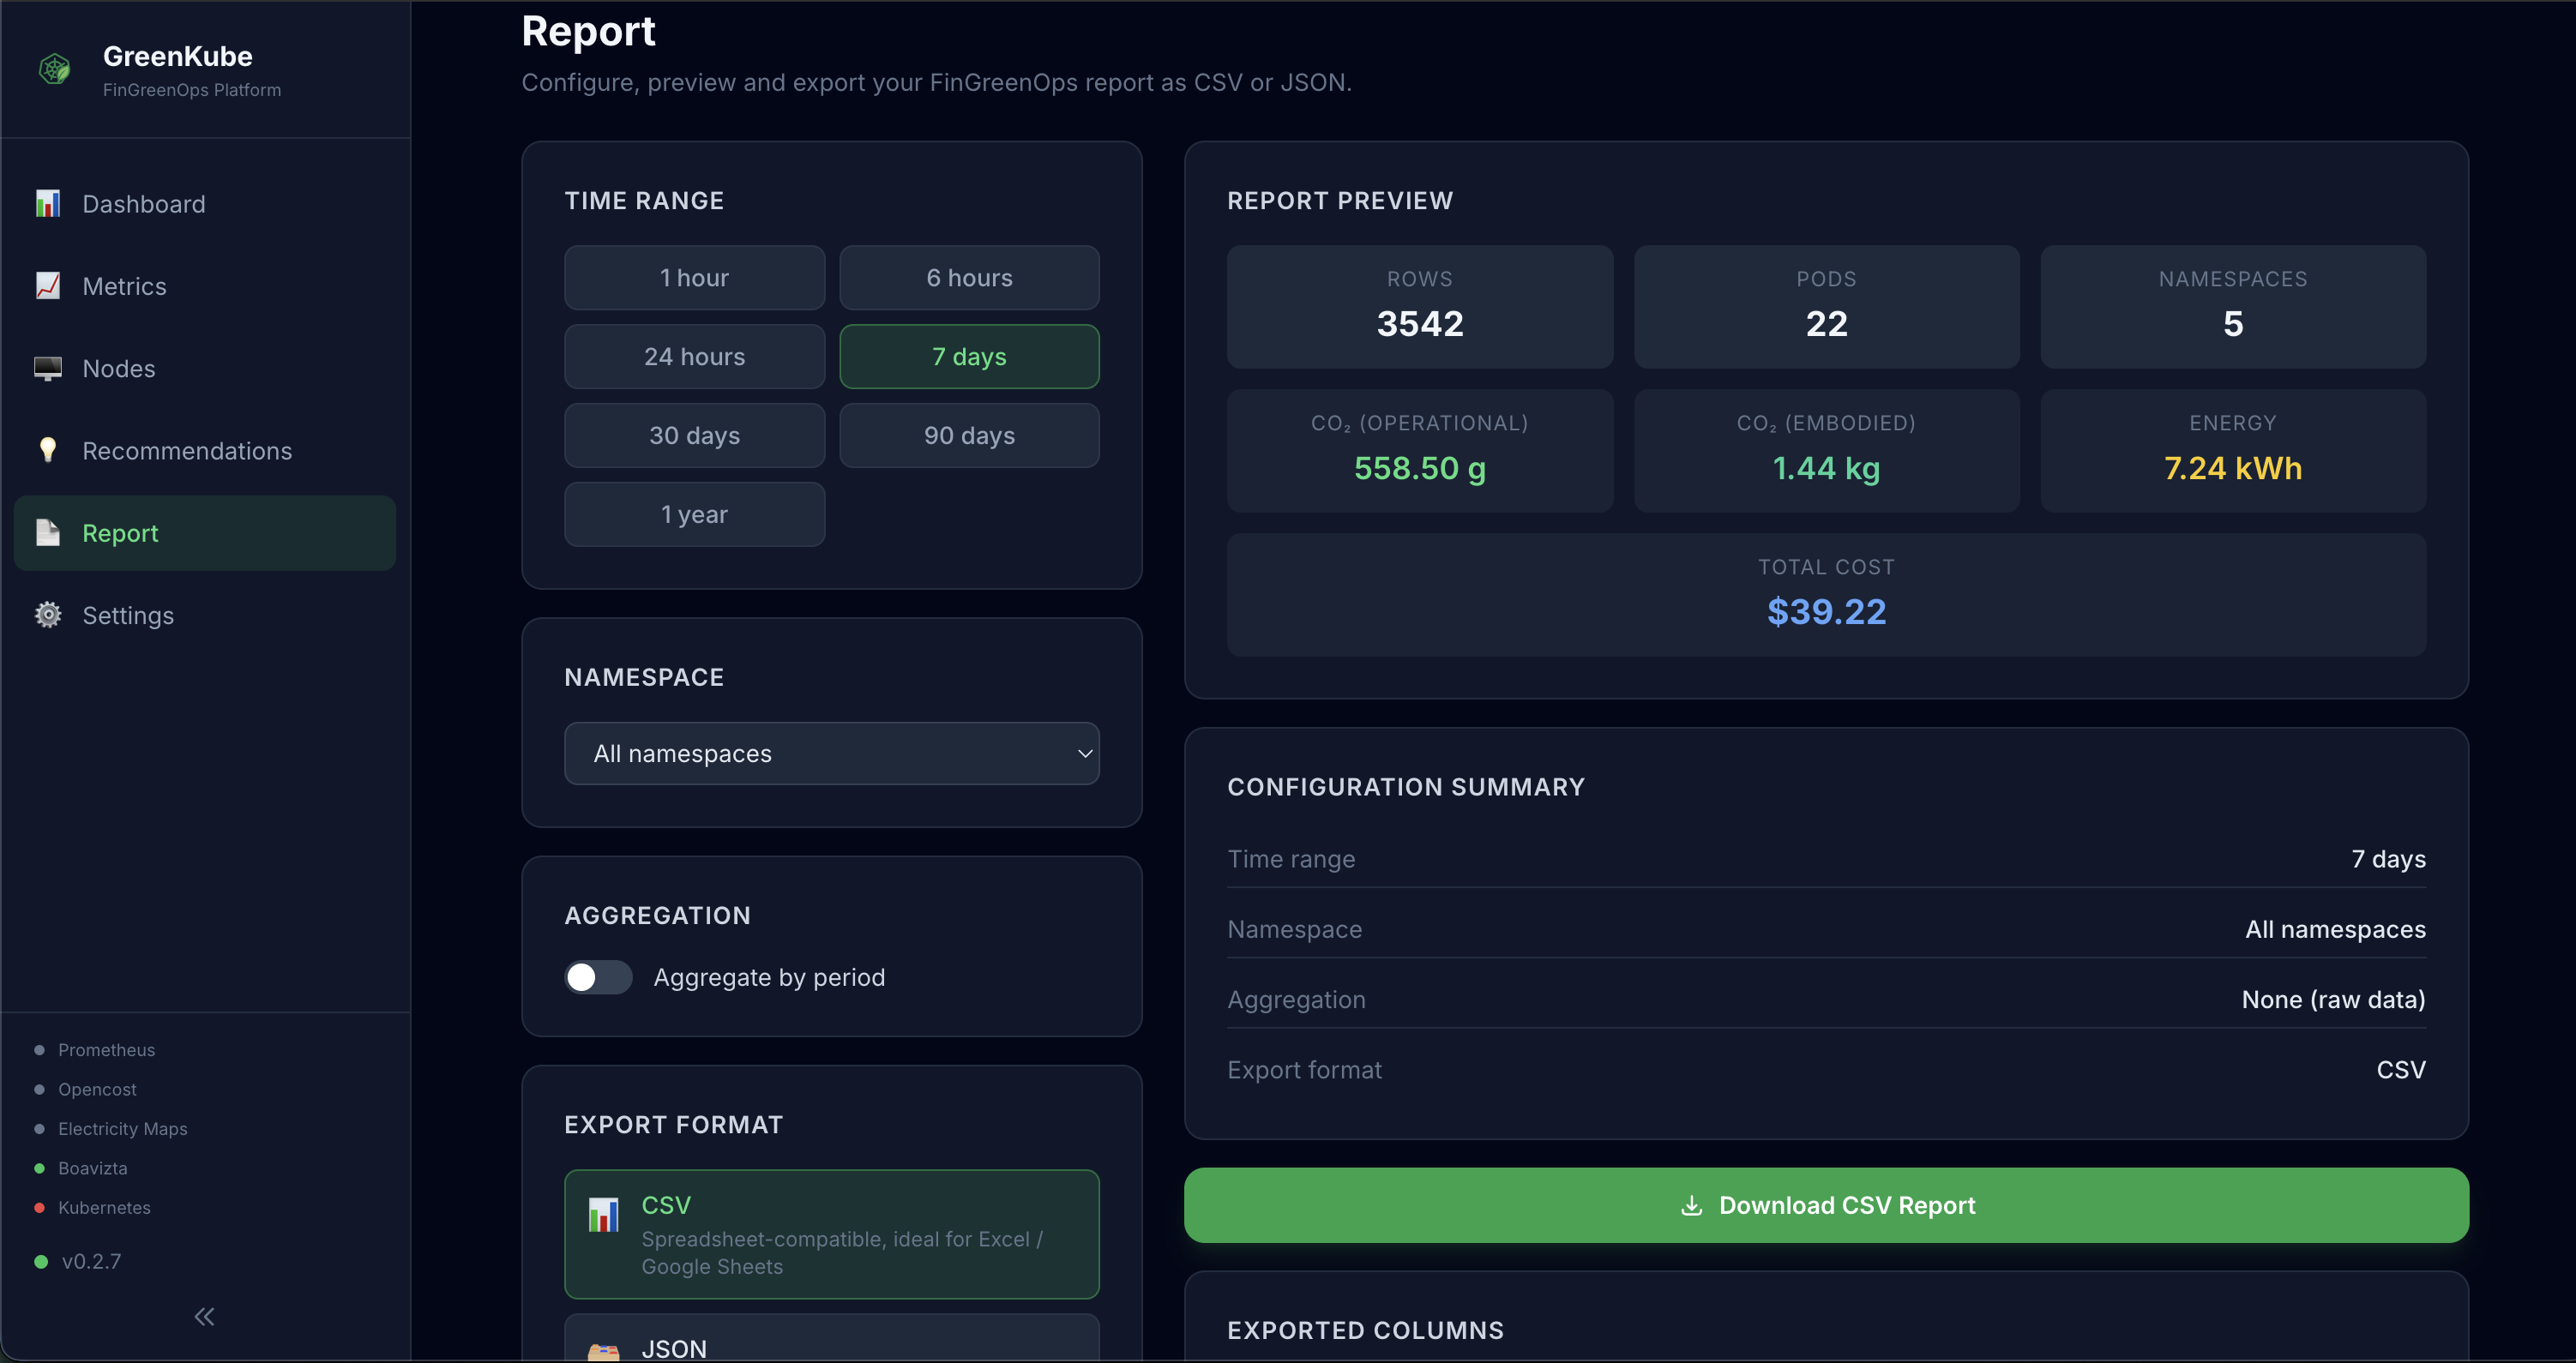
📋 Report
Section titled “📋 Report”Visual report builder for CSRD/ESRS E1 exports:
- Time range picker — relative window (1h → ytd) or custom
start/enddates, or full calendar year (--years 2024) - Namespace filter — scope to a specific team/environment
- Granularity — hourly, daily, weekly, monthly, yearly
- Preview — row count and totals before downloading
- Export — direct browser download to CSV or JSON
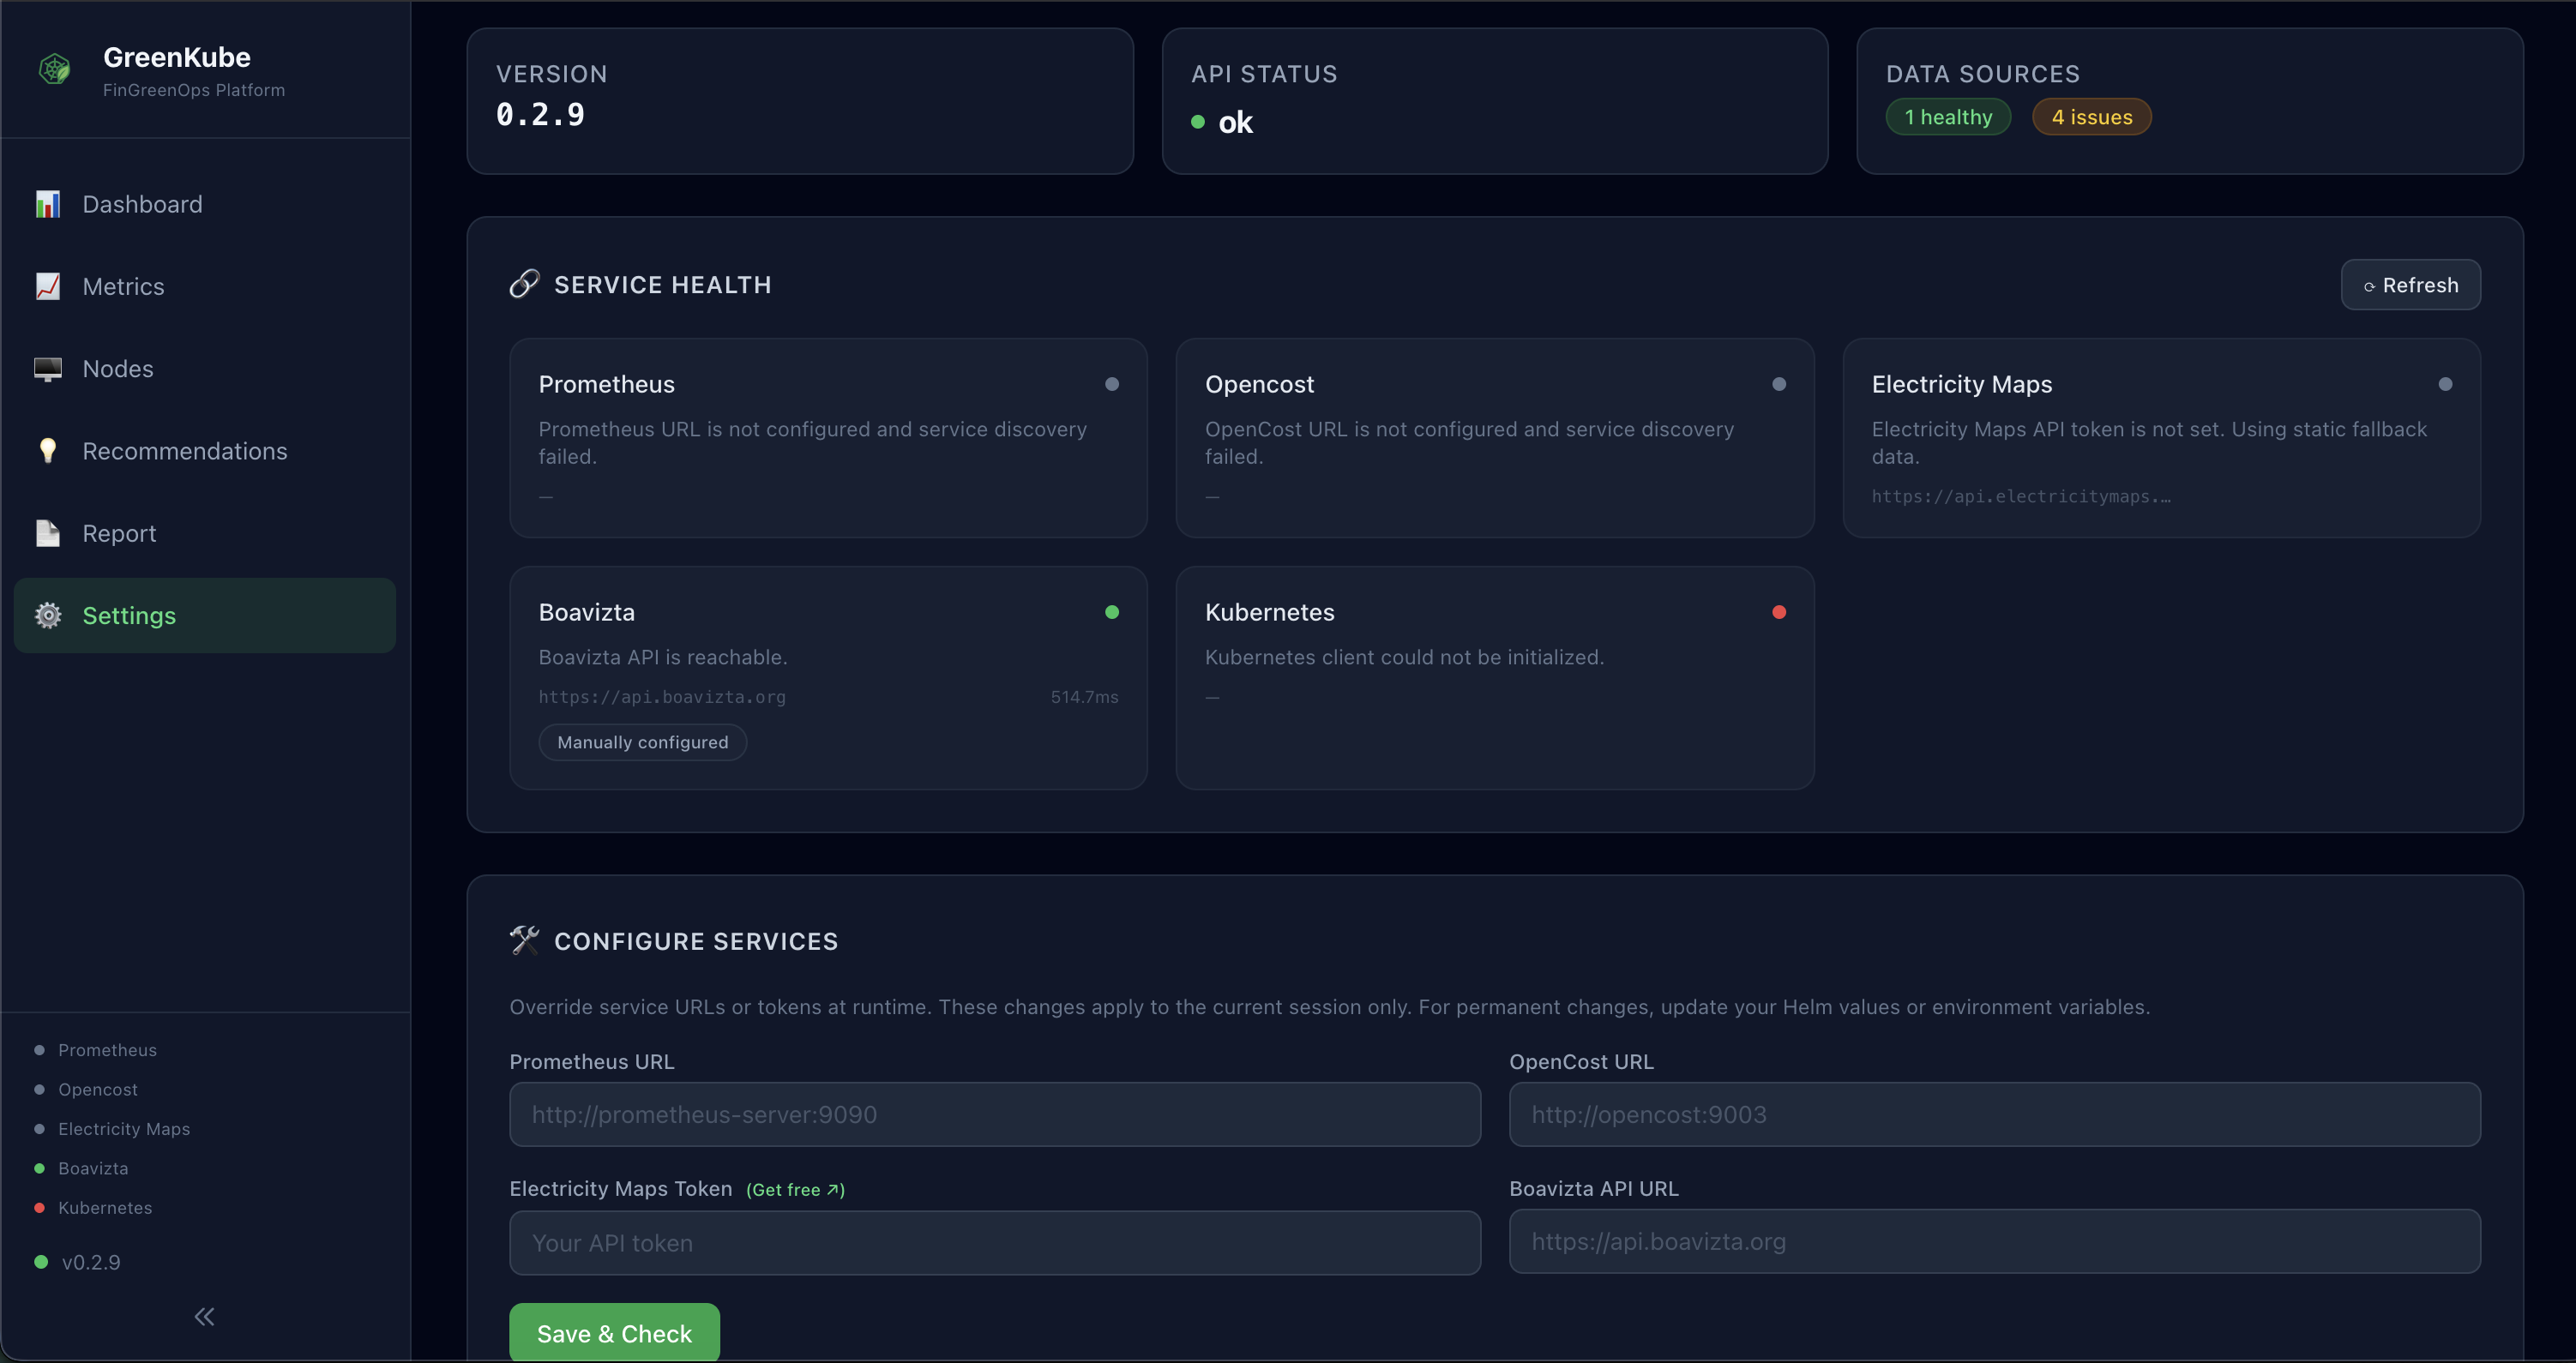
⚙️ Settings
Section titled “⚙️ Settings”System configuration and health status:
- Service Health — Popup-style health check for all data sources (Prometheus, OpenCost, Electricity Maps, Boavizta, Kubernetes, Database) with icons and last-checked timestamps
- Version — Current GreenKube version
- Configuration — Active settings form for Prometheus URL, OpenCost URL, cloud provider, and default zone — changes are applied and persisted to a K8s Secret without restart
- API Key — Set or clear the bearer token for API access
Dashboard Features
Section titled “Dashboard Features”Theme Support
Section titled “Theme Support”The dashboard supports both light and dark modes, detected automatically from your system preferences.
Responsive Design
Section titled “Responsive Design”Fully responsive layout that works on:
- Desktop monitors
- Tablets
- Mobile phones
Data Export
Section titled “Data Export”Export capabilities are available on most pages:
- CSV — For spreadsheet analysis
- JSON — For programmatic processing
Real-time Updates
Section titled “Real-time Updates”The dashboard polls the API at regular intervals to display near-real-time data. WebSocket support is available when the connection allows it.