Grafana & Prometheus Integration
import { Aside, Steps } from ‘@astrojs/starlight/components’;
GreenKube exposes Prometheus metrics at /prometheus/metrics and ships with a pre-built Grafana dashboard (v2) for comprehensive FinGreenOps monitoring.
Dashboard Preview
Section titled “Dashboard Preview”See the shipped Grafana dashboard before installing anything:
Prometheus Integration
Section titled “Prometheus Integration”Automatic Setup (kube-prometheus-stack)
Section titled “Automatic Setup (kube-prometheus-stack)”If you use the kube-prometheus-stack (Prometheus Operator), enable the ServiceMonitor in your values.yaml:
monitoring: serviceMonitor: enabled: true # Creates a ServiceMonitor resource namespace: monitoring # Must match your Prometheus serviceMonitorNamespaceSelector interval: 30s networkPolicy: enabled: true # Allows Prometheus to reach the GreenKube API port prometheusNamespace: monitoringManual Prometheus Setup
Section titled “Manual Prometheus Setup”If you’re not using the Prometheus Operator, add a scrape config manually:
# Add to your prometheus.ymlscrape_configs: - job_name: 'greenkube' scrape_interval: 30s metrics_path: /prometheus/metrics static_configs: - targets: ['greenkube-api.greenkube.svc.cluster.local:8000']Exposed Prometheus Metrics
Section titled “Exposed Prometheus Metrics”GreenKube exposes the following gauges:
Pod-Level Metrics (labels: cluster, namespace, pod, node, region)
Section titled “Pod-Level Metrics (labels: cluster, namespace, pod, node, region)”| Metric | Description |
|---|---|
greenkube_pod_co2e_grams | GHG Scope 2 emissions per pod (operational) |
greenkube_pod_embodied_co2e_grams | GHG Scope 3 emissions per pod (hardware manufacturing) |
greenkube_pod_energy_joules | Energy consumption per pod |
greenkube_pod_cost_dollars | Cost allocation per pod |
greenkube_pod_cpu_usage_millicores | CPU utilization per pod |
greenkube_pod_memory_usage_bytes | Memory usage per pod |
greenkube_pod_restart_count | Container restart count per pod |
Cluster-Wide Metrics (label: cluster)
Section titled “Cluster-Wide Metrics (label: cluster)”| Metric | Description |
|---|---|
greenkube_cluster_co2e_grams_total | Total Scope 2 CO₂e for the cluster |
greenkube_cluster_embodied_co2e_grams_total | Total Scope 3 CO₂e for the cluster |
greenkube_cluster_cost_dollars_total | Total cost |
greenkube_cluster_energy_joules_total | Total energy |
greenkube_cluster_pod_count | Total pod count |
greenkube_cluster_namespace_count | Total namespace count |
greenkube_sustainability_score | Composite 0–100 sustainability score |
greenkube_sustainability_dimension_score | Per-dimension score (7 dimensions) |
greenkube_recommendations_total | Active recommendation counts by namespace, type, and priority |
greenkube_recommendations_implemented_total | Applied recommendation counts by namespace and type |
greenkube_recommendations_savings_co2e_grams | Projected annual CO₂e savings by recommendation type |
greenkube_recommendations_savings_cost_dollars | Projected annual cost savings by recommendation type |
greenkube_co2e_savings_attributed_grams_total | Cumulative CO₂e savings from applied recommendations |
greenkube_cost_savings_attributed_dollars_total | Cumulative cost savings from applied recommendations |
greenkube_top_recommendations | Ranked active recommendations by projected annual savings — labels: rank, sort_metric, value_metric, namespace, type, resource, scope, priority |
greenkube_namespace_recommendation_savings_co2e_grams_total | Total potential CO₂e savings from active recommendations per namespace |
greenkube_namespace_recommendation_savings_cost_dollars_total | Total potential cost savings from active recommendations per namespace |
Grid Intensity Metrics
Section titled “Grid Intensity Metrics”| Metric | Description |
|---|---|
greenkube_carbon_intensity_score | Energy-weighted average grid intensity |
greenkube_carbon_intensity_zone | Real-time grid intensity per Electricity Maps zone |
Grafana Dashboard (v2)
Section titled “Grafana Dashboard (v2)”The dashboard was rebuilt in v0.2.10 and extended in v0.2.11 with the Actionable Recommendations row.
Import the Dashboard
Section titled “Import the Dashboard”-
Get the dashboard JSON
The dashboard file is at
dashboards/greenkube-grafana.jsonin the GreenKube repository. -
Import in Grafana
In Grafana, go to Dashboards → Import, then either:
- Upload the
greenkube-grafana.jsonfile, or - Paste the JSON content directly
- Upload the
-
Select your data source
Choose the Prometheus data source that scrapes GreenKube metrics.
-
Click Import
The dashboard is ready to use immediately.
Dashboard Structure (5 Sections)
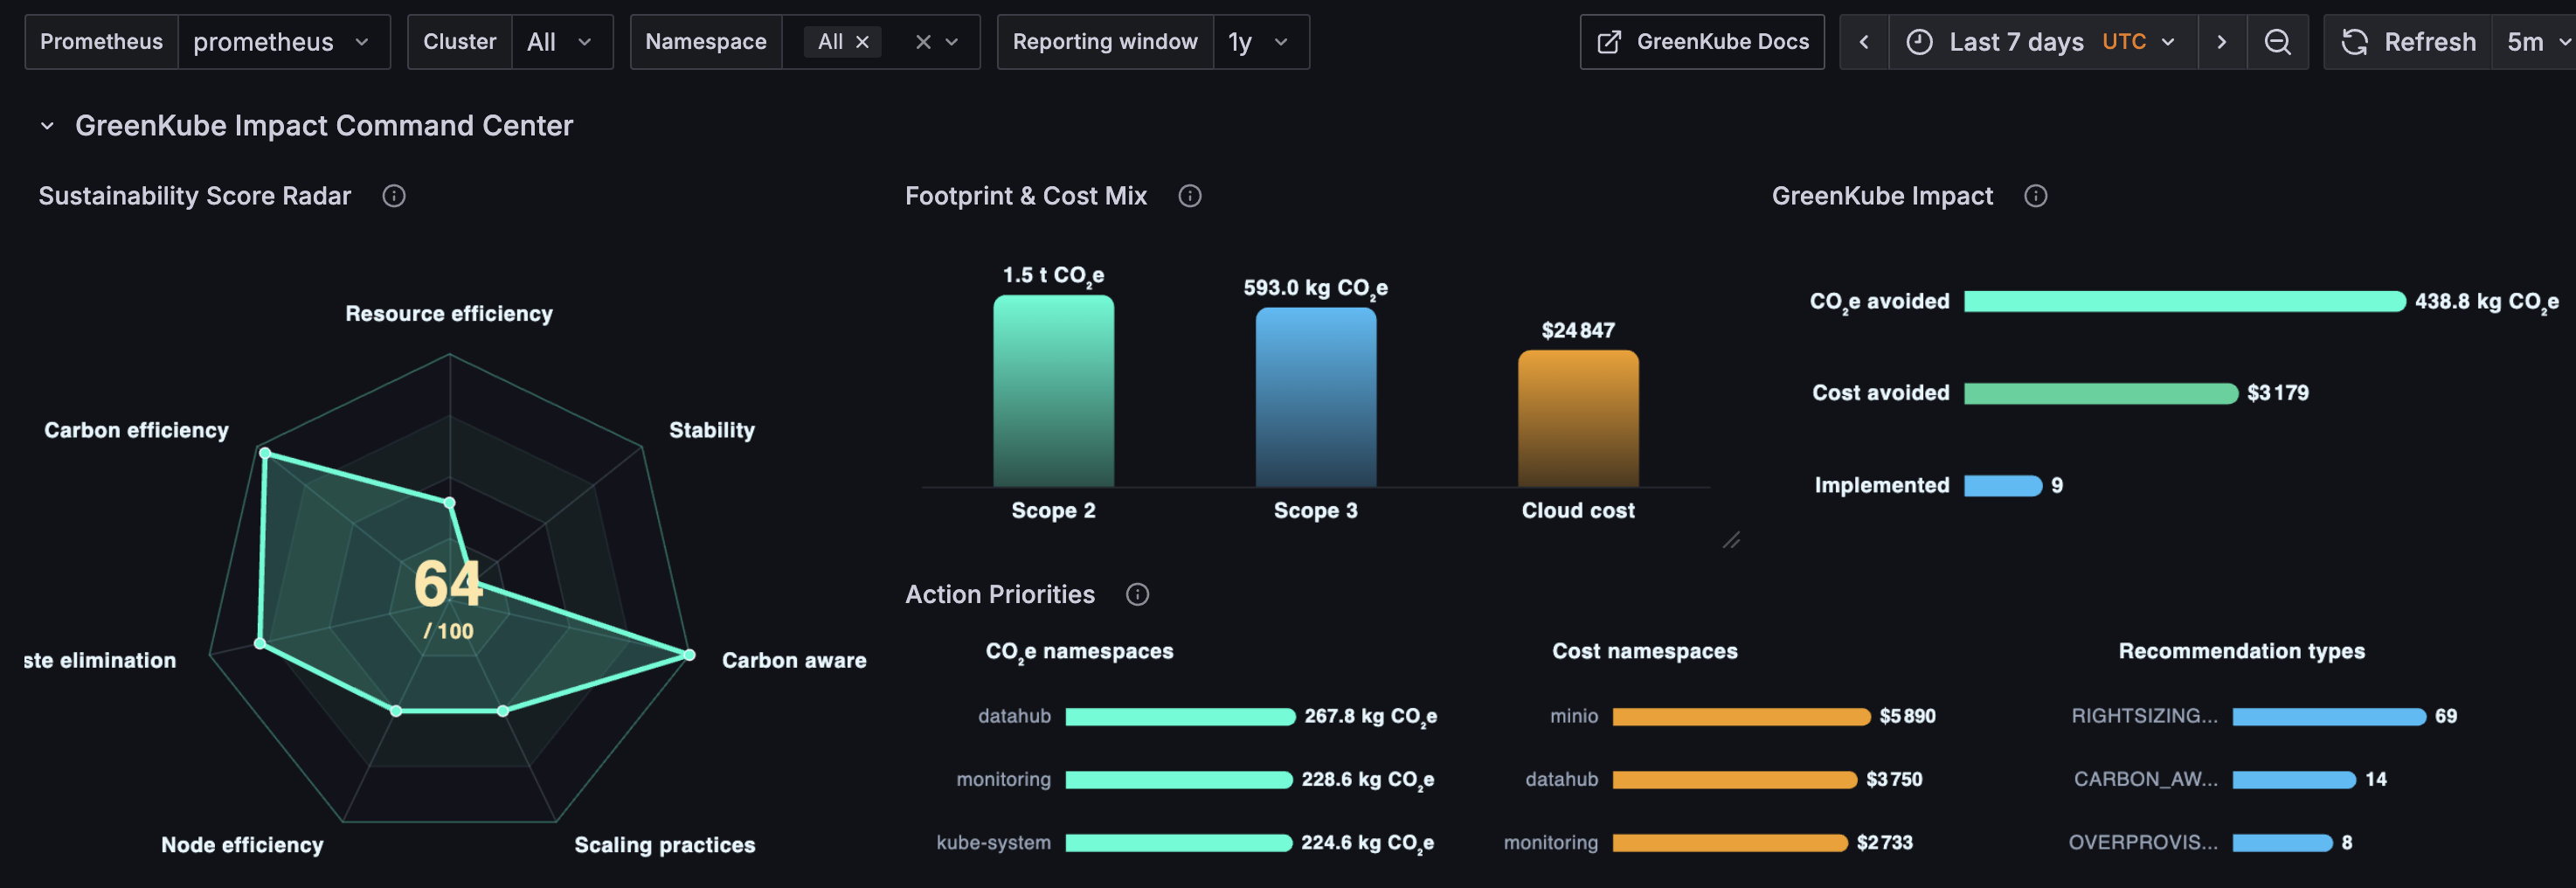
Section titled “Dashboard Structure (5 Sections)”1. GreenKube Impact Command Center
Section titled “1. GreenKube Impact Command Center”Strategic overview of cluster sustainability and savings.
- Sustainability Score — Composite 0–100 gauge from 7 dimensions (resource efficiency, carbon efficiency, waste elimination, node efficiency, scaling practices, carbon-aware scheduling, stability)
- Footprint Mix — Pie chart: Scope 2 vs. Scope 3 CO₂e breakdown
- Impact Ledger — Timeline of attributed CO₂e and cost savings from applied recommendations
- Action Priorities — Bar chart: top recommendation types by count
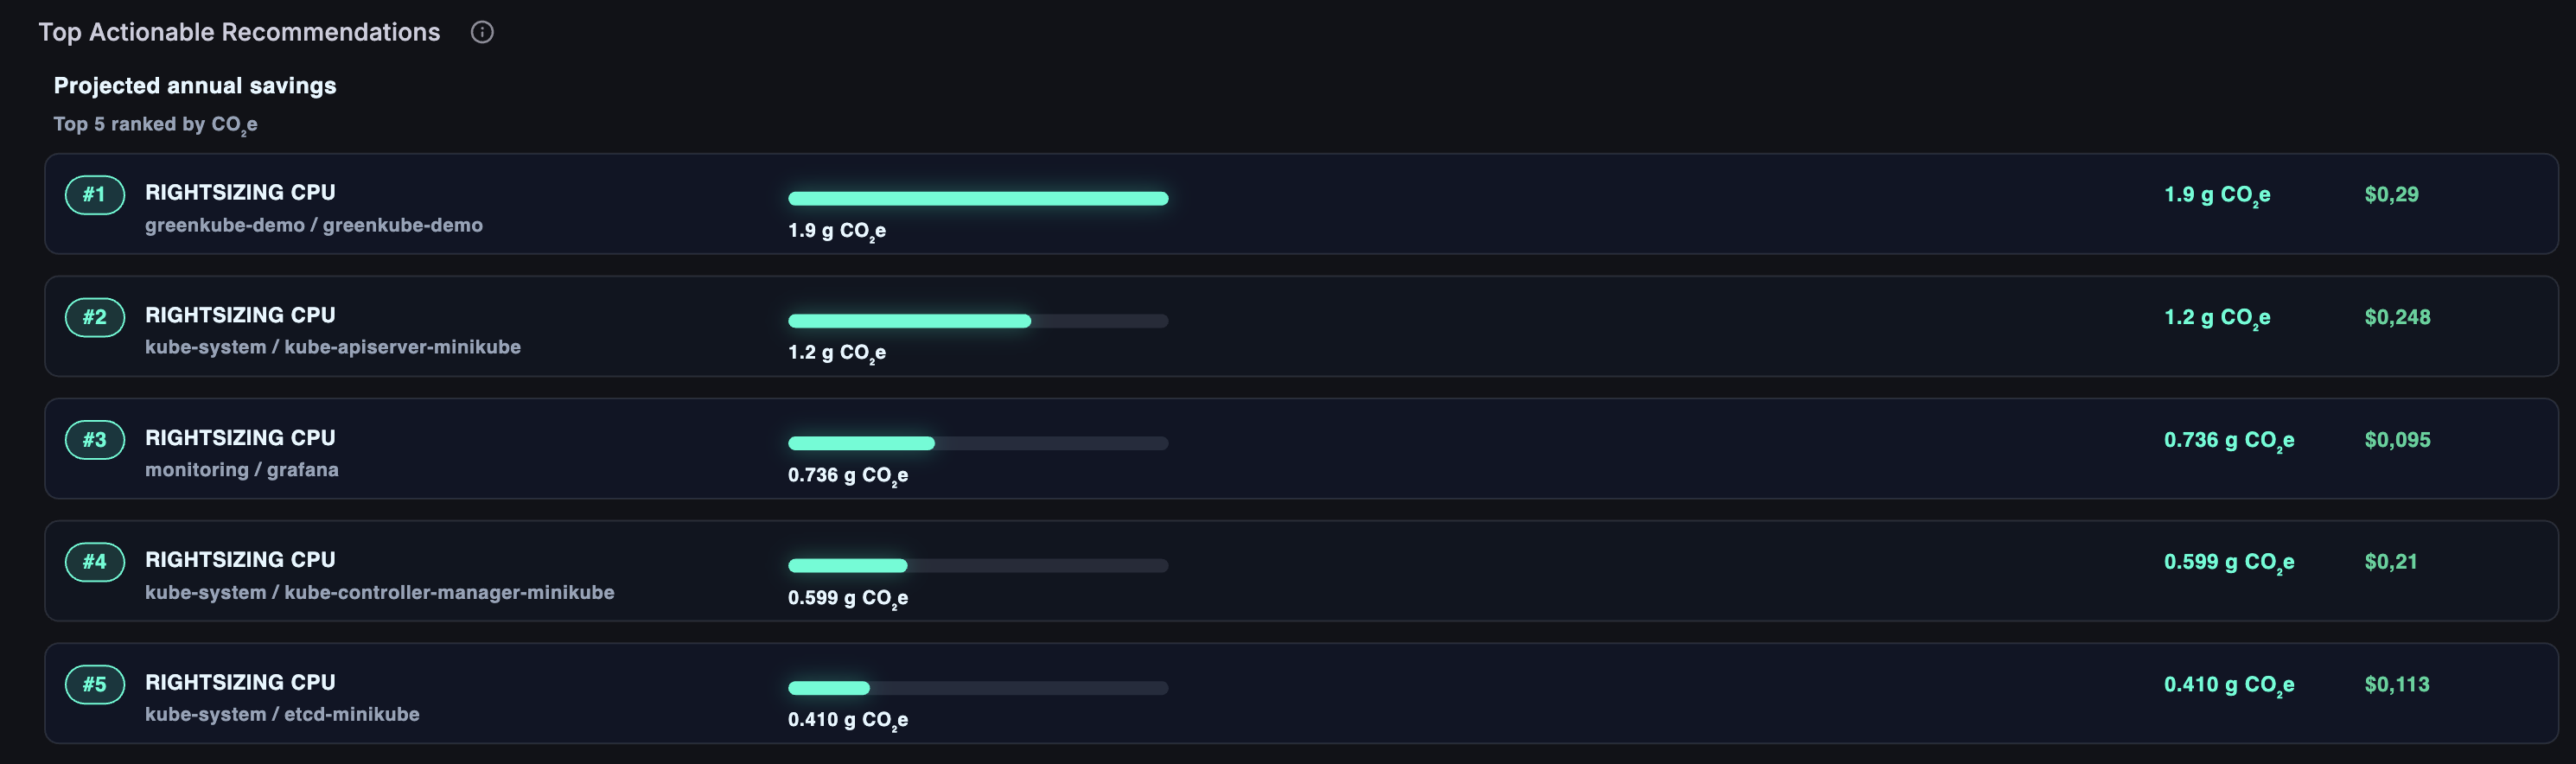
2. Actionable Recommendations (added in v0.2.11)
Section titled “2. Actionable Recommendations (added in v0.2.11)”Highest-impact active recommendations ranked by projected annual savings.
- Top Actionable Recommendations — Horizontal bar cards showing rank, type, target resource, and projected annual CO₂e + cost savings. Toggle ranking metric between CO₂e and Cost via the
$recommendation_metricvariable; adjust the number of displayed items via$recommendation_limit.
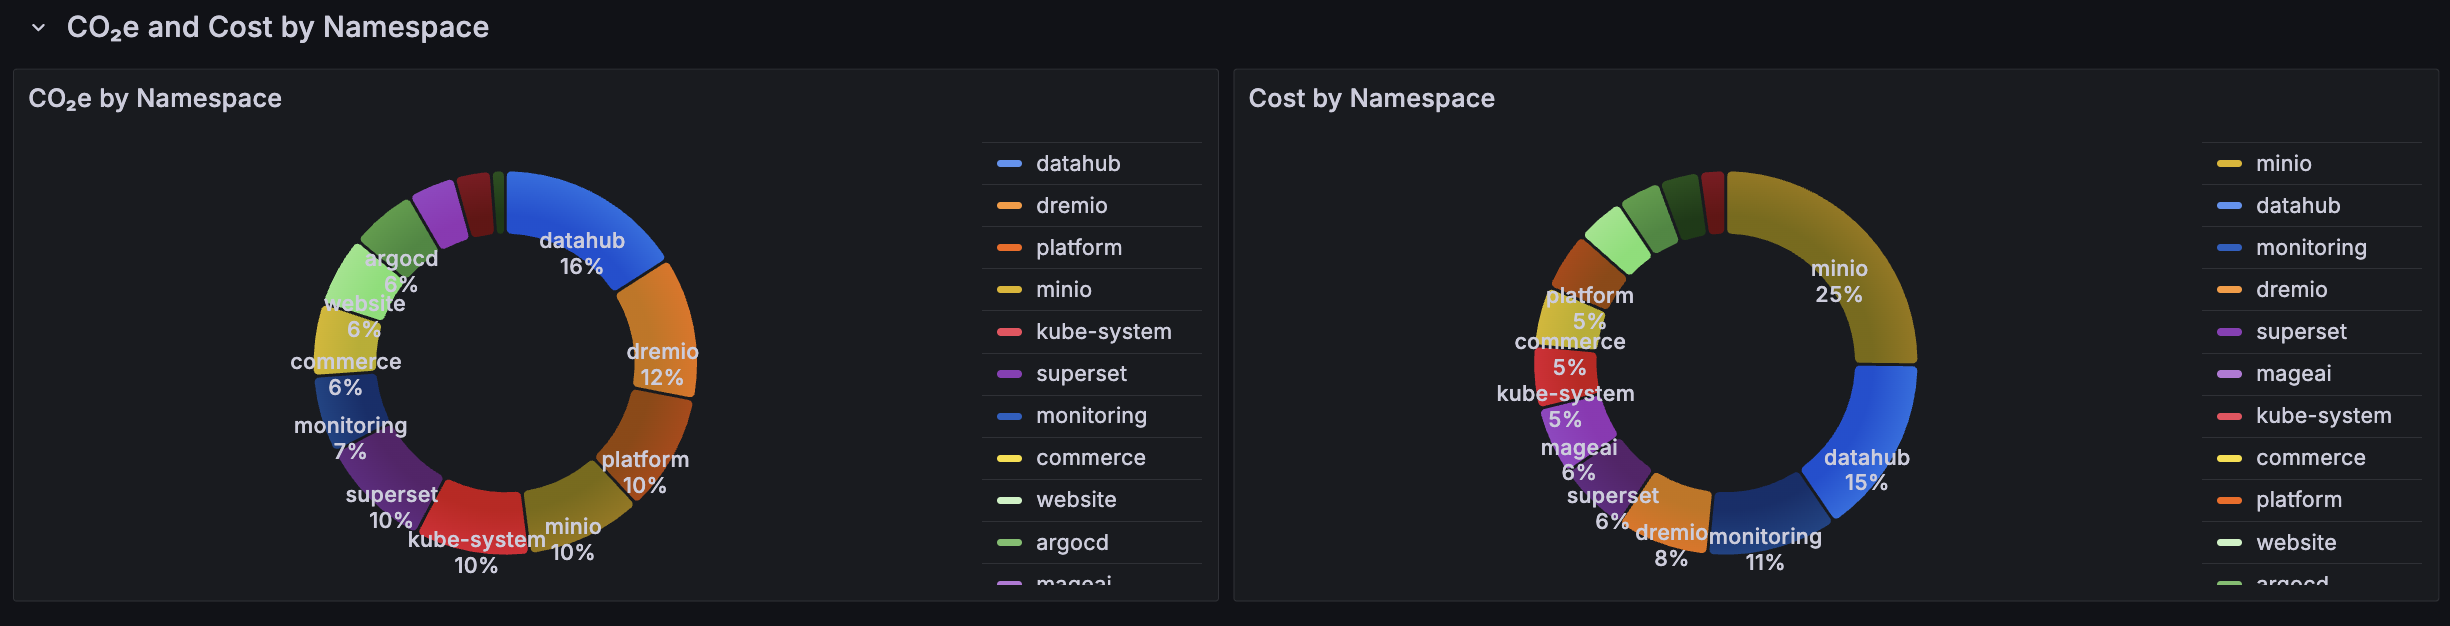
3. CO₂e and Cost by Namespace
Section titled “3. CO₂e and Cost by Namespace”Operational carbon breakdown for per-team accountability.
- Pie charts: Scope 2 CO₂e per namespace, Scope 3 CO₂e per namespace, Total CO₂e per namespace
- Sorted by top emitters; filters by
$clusterand$namespacevariables
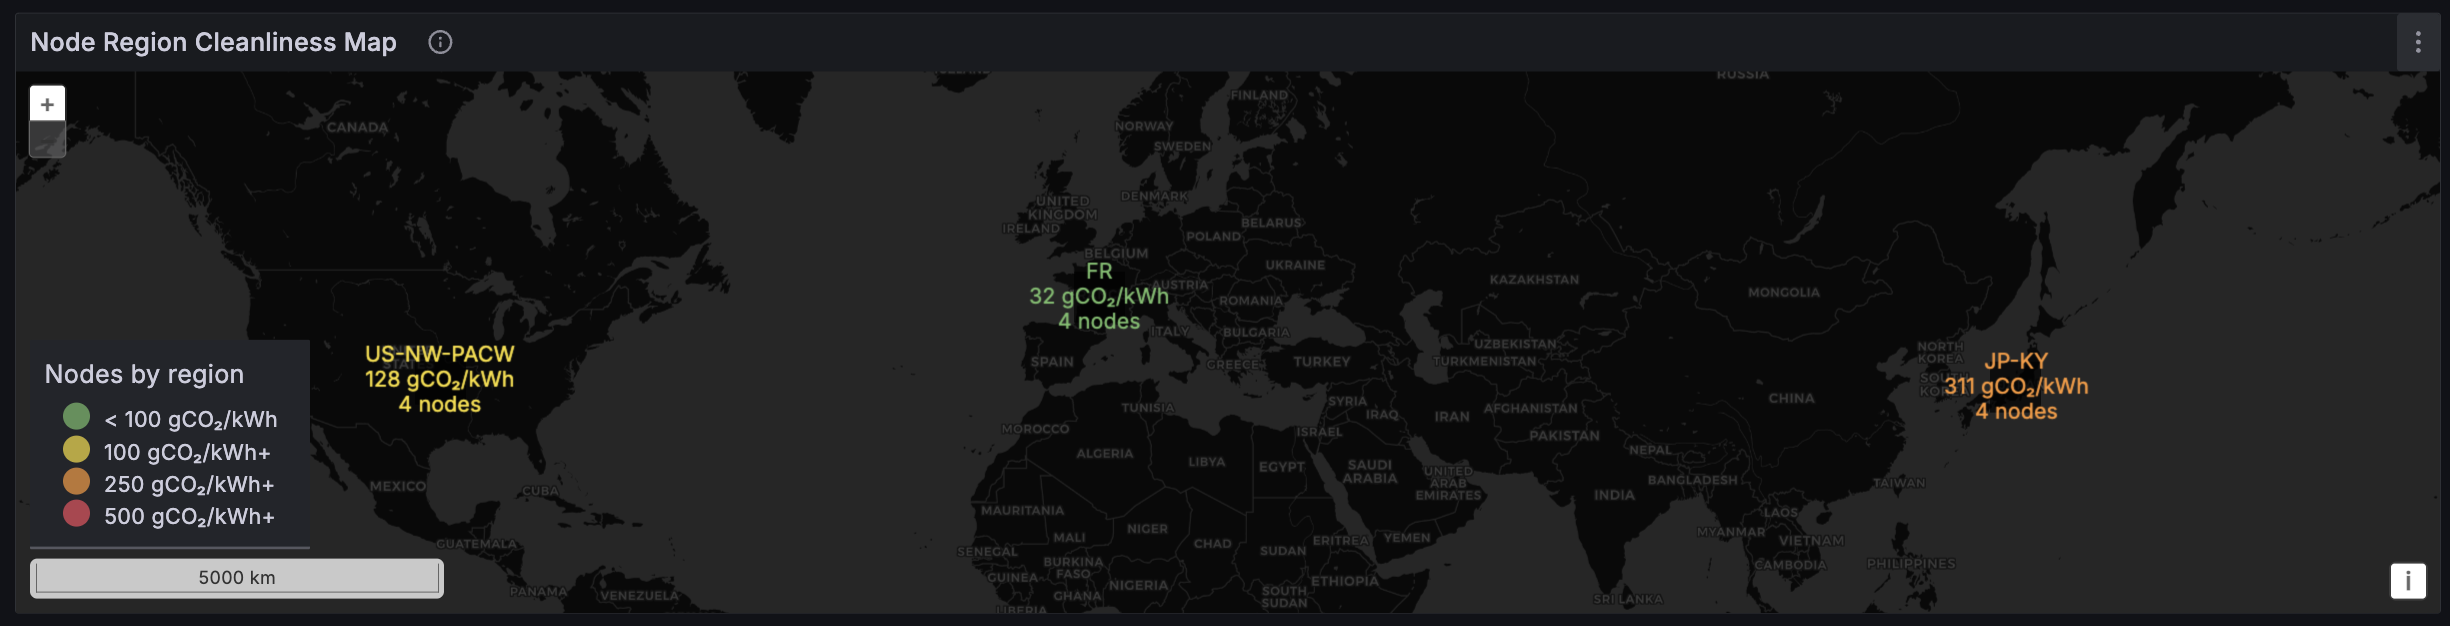
4. Regional Node Cleanliness
Section titled “4. Regional Node Cleanliness”Geographic view of infrastructure carbon intensity.
- Geomap with node count bubbles; bubble color reflects grid carbon intensity per Electricity Maps zone
- Filters by cluster
5. Top Emitters & Spenders
Section titled “5. Top Emitters & Spenders”Pod-level detail for targeted optimization.
- Top-15 pods by CO₂e emissions (bar chart, instant query)
- Top-15 pods by cost (bar chart, instant query)
Template Variables
Section titled “Template Variables”| Variable | Description |
|---|---|
$cluster | Filter all panels by cluster name |
$namespace | Filter all panels by namespace |
$dashboard_window | Reporting window: 1h, 6h, 24h, 7d, 30d, YTD, 1y |
$recommendation_metric | Ranking metric for Actionable Recommendations: CO₂e or Cost |
$recommendation_limit | Number of recommendations to show: 3, 5, or 10 |
All panels respect $cluster and $namespace consistently. The $node and $region variables were removed in v0.2.11.
PromQL Notes
Section titled “PromQL Notes”The dashboard uses correct aggregation for multi-instance metrics:
- Cluster scalars:
sum(max by (cluster)(greenkube_cluster_co2e_grams_total{cluster="$cluster"})) - Namespace breakdowns:
sum by (namespace)(greenkube_pod_co2e_grams{...}) - Pod-level top-N:
topk(15, max by (pod, namespace)(greenkube_pod_co2e_grams{...}))
This prevents value inflation from multiple Prometheus scrape instances.
Customization
Section titled “Customization”The dashboard is fully customizable in Grafana. Common additions:
- Grafana alerts on
greenkube_sustainability_scorefor carbon budget enforcement - Additional namespace filters
- Custom panels using any of the GreenKube Prometheus metrics
Related
Section titled “Related”- REST API — API endpoints powering the metrics
- Dashboard Guide — Built-in web dashboard
- Configuration — Monitoring configuration options